
Introduction
A common misconception persists in molecular biology labs: relying solely on spectrophotometers (e.g., Nanodrop) to assess nucleic acid purity and quality. While instruments like Nanodrop provide valuable data, their limitations in evaluating broad-spectrum purity often lead to experimental failures. This article clarifies why gel electrophoresis is indispensable for ensuring reliable RNA integrity and purity.
Narrow-Sense vs. Broad-Sense Purity: A Fundamental Distinction
To resolve confusion, we must differentiate two critical concepts:
Narrow-Sense Purity
Refers to the absence of residual proteins (A260/A280 ratio) and salt ions (A260/A230 ratio).
Broad-Sense Purity
Encompasses all factors affecting usability, including:
- Residual DNA contamination
- RNA degradation (fragmented RNA)
- Invisible contaminants (e.g., polysaccharides, polyphenols)
Nanodrop spectrophotometers excel at assessing narrow-sense purity but fail to detect broader issues like DNA carryover, RNA degradation, or non-protein contaminants.
Why Spectrophotometers Fall Short
Blind to DNA Contamination
Genomic DNA absorbs light at 260 nm, inflating RNA concentration readings. For example, a sample with 50% DNA contamination may falsely report double the RNA concentration.
Misses RNA Degradation
Degraded RNA fragments exhibit a hyperchromic effect, artificially elevating OD260 values. Spectrophotometers cannot distinguish intact RNA from fragmented RNA.
Ignores “Invisible” Contaminants
Polysaccharides, polyphenols, or enzymatic inhibitors (common in plant or bone tissues) do not absorb UV light at standard wavelengths, evading detection.
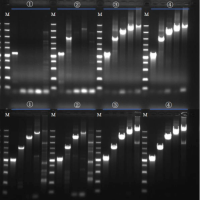
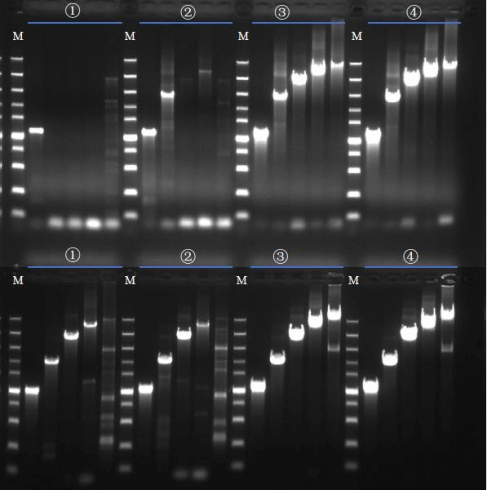
Gel Electrophoresis: The Definitive Quality Check
Gel electrophoresis provides visual validation of nucleic acid integrity and purity:
RNA Integrity
- Sharp 28S/18S ribosomal RNA bands (animal samples) confirm intact RNA.
- Degraded RNA appears as a smear, even if OD ratios are “perfect.”
DNA Contamination
Discrete genomic DNA bands reveal contamination invisible to spectrophotometers.
Quantitative Accuracy
Intact RNA concentrations correlate with band intensity, unlike fragmented RNA with inflated OD values.
Case Study
A lab measured “high-quality” RNA (A260/A280 = 2.0) via Nanodrop, but RT-qPCR failed. Gel electrophoresis revealed severe RNA degradation and DNA contamination—issues entirely missed by spectrophotometry.
Consequences of Skipping Electrophoresis
Using spectrophotometers alone risks:
False High Concentrations
Degraded RNA or contaminants inflate OD260, leading to overestimation of usable RNA.
Downstream Experimental Failures
- Scenario A: Severely degraded RNA → Failed reverse transcription.
- Scenario B: Partially degraded RNA → Inaccurate quantification (e.g., qPCR Ct value shifts).
- Scenario C: DNA contamination → Incorrect RNA concentration adjustments.
- Scenario D: Enzyme inhibitors → Reduced reverse transcription efficiency.
Real-World Example
Plant RNA extracts with polyphenol contamination showed “ideal” OD ratios but completely inhibited downstream reactions. Electrophoresis detected no RNA bands, exposing the flaw in relying solely on spectrophotometers.
A Standardized Workflow for Reliable Results
Dual Verification
- Use spectrophotometers for narrow-sense purity (A260/A280 and A260/A230).
- Validate broad-sense purity via gel electrophoresis.
Critical Thresholds
- Intact RNA: 28S band intensity should be 1.5–2× the 18S band.
- Degraded RNA: Discard samples showing smearing ≥50% of the lane.
Sample-Specific Awareness
Challenging samples (e.g., plant tissues, bone): Prioritize electrophoresis even if OD values appear normal.
Conclusion
In precision-driven research, overlooking gel electrophoresis is a gamble. While spectrophotometers efficiently screen for protein and salt contaminants, only electrophoresis can confirm RNA integrity, detect DNA carryover, and expose invisible inhibitors. Integrate both methods to ensure your nucleic acid prep is truly “pure”—not just on paper, but in practice.