In molecular biology laboratories, RNA extraction is a fundamental yet critical step. However, many researchers fall into a common detection trap: equating the optical density (OD) values measured by spectrophotometers (e.g., Nanodrop) directly with RNA concentration and quality. This misconception is silently undermining experimental data worldwide. Let’s unravel this technical myth.
I. Principles and Limitations of Spectrophotometry
Spectrophotometers estimate nucleic acid concentration by measuring absorbance at 260 nm (OD value). This calculation assumes that the solution contains only pure, intact RNA and that OD variations are solely caused by the target RNA. In reality, this ideal scenario is nearly unattainable in practice.
Three Major Interference Sources
Protein Contamination: Residual proteins absorb light at 280 nm, skewing the A260/A280 ratio.
DNA Residue: Genomic DNA also absorbs at 260 nm.
RNA Degradation: Short RNA fragments from degradation exhibit a hyperchromic effect, artificially inflating OD values.
Case Study: A lab reported an RNA concentration of 2000 ng/μL using a spectrophotometer, yet reverse transcription failed. Electrophoresis later revealed complete RNA degradation—the “high concentration” was merely an artifact from fragmented RNA.
II. The Necessity of Dual Verification
| Type of Misjudgment | Detection Blind Spot | Experimental Consequence |
|---|---|---|
| False High Concentration | OD interference from impurities/degraded RNA | Failed downstream experiments, wasted reagents |
| Misinterpretation of Low Concentration | Lack of knowledge about sample-specific baselines | Discarding valid samples, delayed research progress |
For example, in plant secondary metabolic tissues: Normal RNA concentrations range between 50–100 ng/μL. If a kit reports 800 ng/μL, phenolic compound contamination likely causes OD inflation—a phenomenon easily identified by smearing on an electrophoresis gel.
III. The Critical Role of Electrophoresis
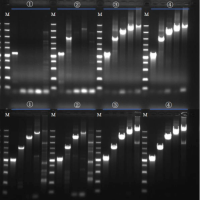
Agarose gel electrophoresis provides visual insights into:
- RNA Integrity: Sharpness of 28S/18S bands (animal samples)
- Degradation Level: Smearing patterns
- Impurity Presence: Abnormal band positions
Key Data: Intact RNA shows a 28S band 1.5–2 times brighter than the 18S band. Diffuse smearing—even with a “perfect” A260/A280 ratio of 2.0—indicates unsuitability for full-length transcriptome analysis.
IV. Standardized Detection Protocol
Dual-Method Approach
Combine OD measurements with electrophoresis validation.
Concentration Correction Formula
True Concentration = Nanodrop Reading × (Intact Band Intensity Ratio)
Sample-Specific Awareness
For challenging samples (e.g., neural tissue), 20 ng/μL of intact RNA outperforms 500 ng/μL of degraded RNA.
Real-World Example: A research group at a top-tier university struggled for six months to replicate experiments. After implementing electrophoresis, they discovered their “high-concentration” commercial RNA extracts contained genomic DNA contamination.
Conclusion
In the era of precision medicine, reliable data begins with standardized protocols. Establishing an “OD Screening + Electrophoresis Verification” system not only rescues failing experiments but also embodies scientific rigor. Remember: True technical excellence is rooted in respecting fundamental principles.
Authored by RNA Extraction Technology Experts. We advocate: Every dataset must withstand the strictest validation.
Related products


