
TINZYME / COMPLETE dNTP QUALITY & PERFORMANCE
Quality measured.
Evidence included.
Explore all 13 source experiment images: 31P-NMR, HPLC, contamination checks, RT-PCR, low-input PCR, long PCR and real-time PCR. Complete source specifications and supplemental stability data are included.
INDIVIDUAL 100 mM SOLUTIONS
≥99%Triphosphate purity
HPLC area specification
Long PCR >30KB Long-range amplification
Stable for 5 years (-20°C), 10 days at RT & 50 freeze-thaw cycles.
View the analytical specifications ↓Purity, concentration, pH and UV identity specifications
50 cycles / 10-day exposure and five-year storage data
Reported long-PCR experiment and real-time PCR curves
01 / ANALYTICAL QUALITY
Defined quality.
Measurable attributes.
Individual Tinzyme 100 mM nucleotide solutions have defined purity, concentration and pH specifications. Optical-density verification, HPLC analysis and functional testing connect chemical quality with DNA synthesis workflows.
| Quality attribute | Published specification / method |
|---|---|
| Appearance | Clear, colorless solution |
| HPLC area purity | ≥99% triphosphate content |
| Stock concentration | 100 mM ±3%; optical-density verification |
| pH at 22–25°C | 7.0 ±0.1 |
| Contamination checks | Reported free of DNase and RNase contamination |
| Functional checks | Taq, Pfu and qPCR performance testing listed |
Nucleotide-specific UV identity
| Product / catalog no. | Peak, nm | A250/A260 | A280/A260 |
|---|---|---|---|
| dATP / D1331 | 259 ±2 | 0.75-0.81 | 0.13-0.18 |
| dCTP / D3331 | 272 ±2 | 0.79-0.85 | 0.93-1.03 |
| dGTP / D2331 | 253 ±2 | 1.11-1.19 | 0.63-0.69 |
| dTTP / D4331 | 267 ±2 | 0.62-0.68 | 0.69-0.79 |
| dUTP / D5331 | 262 ±2 | 0.72-0.78 | 0.34-0.40 |
These are acceptance specifications, not measured results for a particular supplied lot. Product links below provide the official specifications. Standard dNTP mix pages list >99% purity.
02 / COMPLETE SOURCE CHARACTERISTICS
The full
nucleotide profile.
Every analytical characteristic from the supplied dossier is retained below. These source values are distinct from current product-page specifications shown above.
| Attribute | dATP | dCTP | dGTP | dTTP | dUTP |
|---|---|---|---|---|---|
| Appearance | Clear, colorless | Clear, colorless | Clear, colorless | Clear, colorless | Clear, colorless |
| Concentration | 100 mM ±5% | 100 mM ±5% | 100 mM ±5% | 100 mM ±5% | 100 mM ±5% |
| UV peak, nm (pH 7.0) | 259 ±2 | 272 ±2 | 253 ±2 | 267 ±2 | 267 ±2 |
| Extinction coefficient* | 15.4 | 9.1 | 13.7 | 9.6 | 9.9 |
| A250/A260 (pH 7.0) | 0.78 ±0.03 | 0.82 ±0.03 | 1.15 ±0.04 | 0.65 ±0.03 | 0.73 ±0.03 |
| A280/A260 (pH 7.0) | 0.15 ±0.02 | 0.98 ±0.05 | 0.66 ±0.03 | 0.74 ±0.05 | 0.38 ±0.03 |
| pH at 22-25°C | 7.0 ±0.1 | 7.0 ±0.1 | 7.0 ±0.1 | 7.0 ±0.1 | 7.0 ±0.1 |
| dNTP, HPLC area | ≥99.0% | ≥99.0% | ≥99.0% | ≥99.0% | ≥99.0% |
| dNDP, HPLC area | <0.7% | <0.7% | <0.7% | <0.7% | <0.7% |
| DNase / RNase / nicking | Negative | Negative | Negative | Negative | Negative |
| Storage | -20°C | -20°C | -20°C | -20°C | -20°C |
| Stability stated | 36 months | 36 months | 36 months | 36 months | 36 months |
| Attribute | dATP | dCTP | dGTP | dTTP | dUTP |
|---|---|---|---|---|---|
| Formula | C10H13N5Na3O12P3 | C9H13N3Na3O13P3 | C10H13N5Na3O13P3 | C10H14N2Na3O14P3 | C9H12N2Na3O14P3 |
| Molecular weight | 557.2 | 533.1 | 573.1 | 548.1 | 534 |
| CAS no. | 1927-31-7 | 102783-51-7 | 93919-41-6 | 18423-43-3 | 102814-08-4 |
Extinction-coefficient numbers are reproduced from the source, which uses the unit notation E × mmol⁻¹ × cm⁻¹. Source product names: 2′-deoxyadenosine-, 2′-deoxycytidine-, 2′-deoxyguanosine-, 2′-deoxythymidine- and 2′-deoxyuridine-5′-triphosphate sodium salt solutions.
Download source characteristics CSV ↓03 / PHOSPHORUS NMR
Four nucleotides.
Four spectra.
The supplied dossier describes per-lot 31P-NMR screening and reports elimination of tetraphosphates, pyrophosphates and PCR-specific inhibitors.
Figure 1. 31P-NMR of dATP

Figure 2. 31P-NMR of dGTP
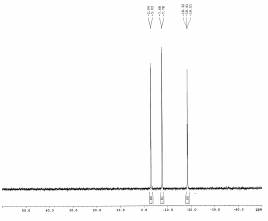
Figure 3. 31P-NMR of dCTP
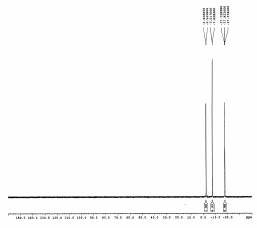
Figure 4. 31P-NMR of dTTP

Peaks are reproduced without alteration. Numerical impurity integrations, acceptance cutoffs and instrument acquisition parameters are not supplied; no impurity percentage has been inferred from the bitmaps.
04 / HPLC CHARACTERIZATION
Chromatographic
evidence.
The dossier reports ≥99.0% triphosphate purity and <0.7% diphosphate content by HPLC area. All four original nucleotide chromatograms are reproduced.
Figure 5. HPLC of dATP
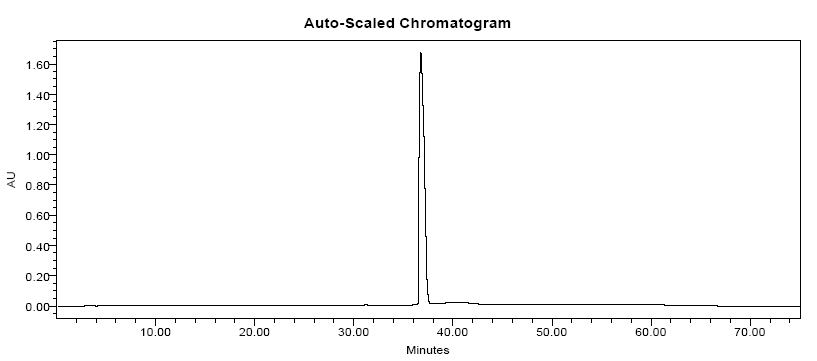
Figure 6. HPLC of dGTP

Figure 7. HPLC of dCTP

Figure 8. HPLC of dTTP

The source does not include per-trace peak integrations, numerical purity readouts or method parameters. No exact per-trace purity is inferred. The ≥99.0% value is the source-reported specification.
05 / BIOLOGICAL QC & ENDPOINT PCR
Controlled checks.
Visible results.
Contamination checks and amplification experiments are presented with their stated results and conditions. Numerical detection limits are not supplied in the source.
| Check | Source-reported result | Evidence supplied |
|---|---|---|
| DNase | Negative / not detected | Dossier characteristics table |
| RNase | Negative / not detected | Dossier characteristics table |
| Nicking activity | Negative / not detected | Dossier characteristics table |
| Protease activity | Absence reported | Dossier QC description |
| Human DNA | Absence reported | Dossier QC description |
| Viral DNA | Absence reported | Dossier QC description |
| Bacterial DNA | Absence reported; gel shown | 16S assay, lanes 2-3 |
Figure 9. Bacterial DNA: controlled 16S assay

RESULT & EXPERIMENTAL CONDITIONS
Observed: No visible assay band in Tinzyme sample lanes 2-3; a band is visible in positive-control lane 4.
Loaded volume: 5 µL per lane. Lane 1: negative control. Lanes 2-3: Tinzyme dNTP mix. Lane 4: positive control. Lane 5: another supplier. M: Marker III.
Figure 10. RT-PCR: 520 bp beta-actin product

RESULT & EXPERIMENTAL CONDITIONS
Observed: Visible amplification products across the displayed RNA-input series, with lower band intensity at lower input.
Human lung total RNA: 10, 5, 1, 0.5, 0.1 and 0.05 ng (lanes 1-6). Reverse transcription: 20 µL. cDNA input to PCR: 2 µL. Target: beta-actin, 520 bp. Gel load: 5 µL per lane. M: Marker III.
Figure 11. Low-input PCR: human genomic DNA

RESULT & EXPERIMENTAL CONDITIONS
Observed: Visible products across the displayed template series, with weaker bands toward the lowest inputs.
Human genomic DNA: 10, 5, 1, 0.5, 0.1 and 0.01 ng (lanes 1-6). Reaction: 50 µL. Gel load: 5 µL per lane. M: Marker III.
06 / LONG PCR & REAL-TIME PCR
See the
amplification.
Representative experiments reproduced from the supplied Tinzyme technical material. Experimental conditions accompany the figures so the data can be interpreted in context.
Long PCR: reported 30 kb target
Lambda-phage DNA, 50 µL reactions and matched template-input series. Tinzyme dNTPs: lanes 1–6; another supplier: lanes 7–12.

| Template input, ng | 2.5 | 1.25 | 0.5 | 0.1 | 0.05 | 0.01 |
|---|---|---|---|---|---|---|
| Tinzyme lane | 1 | 2 | 3 | 4 | 5 | 6 |
| Comparator lane | 7 | 8 | 9 | 10 | 11 | 12 |
Real-time PCR: representative curves
The supplied Tinzyme qPCR trace shows sigmoidal fluorescence curves with different amplification onsets.
Cq values, dilution identities, efficiency, R² and replicate statistics are not supplied.

07 / SUPPLEMENTAL STABILITY
Stress-tested.
Results reported.
Selected-lot HPLC observations from Tinzyme’s published stability report.
50 freeze-thaw cycles
| Nucleotide | Lot no. | Initial, % | After 50 cycles, % |
|---|---|---|---|
| dATP | 120201-2 | 99.20 | 98.80 |
| dCTP | 120101-2 | 99.90 | 99.60 |
| dGTP | 110401 | 99.50 | 99.20 |
| dTTP | 110303-1 | 99.80 | 99.40 |
10-day thermal exposure
| Nucleotide | Lot no. | Initial, % | 25°C, 10 days, % | 37°C, 10 days, % |
|---|---|---|---|---|
| dATP | 101101 | 99.60 | 99.40 | 95.00 |
| dCTP | 101101 | 99.80 | 99.90 | 96.70 |
| dGTP | 101101 | 99.70 | 99.50 | 95.00 |
| dTTP | 101101 | 99.50 | 99.40 | 95.60 |
Five-year storage observations
| Nucleotide | Lot no. | Initial | Year 1 | Year 2 | Year 3 | Year 4 | Year 5 |
|---|---|---|---|---|---|---|---|
| dATP | 090901-1 | 99.80 | 99.68 | 99.60 | 99.54 | 99.27 | 99.30 |
| dCTP | 090301-1 | 99.82 | 99.73 | 99.70 | 99.65 | 99.60 | 99.57 |
| dGTP | 90101 | 99.54 | 99.47 | 99.44 | 99.39 | 99.35 | 99.36 |
| dTTP | 91001 | 99.77 | 99.63 | 99.60 | 99.59 | 99.31 | 99.28 |
COMPLETE EVIDENCE INDEX
Every test.
Every supplied result.
The complete technical package includes all 13 source experiment images, all source characteristics and each stated contamination check. Download the test-to-result index for a line-by-line reference.
Download complete test and result index ↓08 / PRODUCT PORTFOLIO
One portfolio.
Flexible formulations.
Choose a balanced four-nucleotide mix for convenient setup, or use separate 100 mM stocks to control individual nucleotide ratios. Every catalog number below links to its official Tinzyme product page.
| Catalog no. | Product | Stock concentration | Format guide |
|---|---|---|---|
| DN30 | dNTP Mix, 2.5 mM each ↗ | 2.5 mM each / 10 mM total | Premixed four-nucleotide solution |
| DN31 | dNTP Mix, 10 mM each ↗ | 10 mM each / 40 mM total | Premixed four-nucleotide solution |
| DN32 | dNTP Mix, 25 mM each ↗ | 25 mM each / 100 mM total | Concentrated four-nucleotide premix |
| D1331 | dATP, 100 mM ↗ | 100 mM | Separate nucleotide stock |
| D2331 | dGTP, 100 mM ↗ | 100 mM | Separate nucleotide stock |
| D3331 | dCTP, 100 mM ↗ | 100 mM | Separate nucleotide stock |
| D4331 | dTTP, 100 mM ↗ | 100 mM | Separate nucleotide stock |
| D5331 | dUTP, 100 mM ↗ | 100 mM | Verify enzyme compatibility for dUTP workflows |
Looking for separate vials of all four bases? Explore the 100 mM dNTP set ↗ and confirm set ordering with sales.
The dossier also lists 100 mM dITP, dNTP powder, and custom, bulk and OEM nucleotide services. Confirm current availability and ordering codes with Tinzyme.
05 / DATA IN CONTEXT
Technical questions,
answered.
What is the purity specification for Tinzyme dNTPs?
Individual 100 mM nucleotide solutions specify at least 99% triphosphate content by HPLC area, a concentration of 100 mM ±3% and pH 7.0 ±0.1 at 22–25°C. These are specifications, not the measured values of every lot. Standard mix pages list >99% purity.
What do the freeze-thaw data show?
In the published 50-cycle experiment, HPLC purity changed from 99.20 to 98.80% for dATP, 99.90 to 99.60% for dCTP, 99.50 to 99.20% for dGTP and 99.80 to 99.40% for dTTP. These observations apply to the listed individual 100 mM lots.
Do the five-year results establish a five-year shelf life?
No. They are selected-lot storage observations. The report does not specify storage temperature, replication or uncertainty. Confirm shelf life using current product and lot documentation.
Which tests and figures are included?
All 13 source experiment images are included: four 31P-NMR spectra, four HPLC chromatograms, bacterial DNA screening, RT-PCR, low-input genomic DNA PCR, long PCR and real-time PCR. Complete source characteristics, all stated contamination checks and supplemental website stability data are included. Numerical results absent from the source have not been invented.
Which product formats are available?
DN30, DN31 and DN32 contain four nucleotides at 2.5, 10 and 25 mM each. D1331, D2331, D3331 and D4331 are separate 100 mM dATP, dGTP, dCTP and dTTP solutions. D5331 is 100 mM dUTP.
How should the nucleotide solutions be stored?
Tinzyme recommends -20°C for daily or weekly use and -70°C for long-term, infrequent use. Minimize freeze-thaw cycles and temperature changes. Follow current product labels and lot documentation.
Source handling and application scope
The supplied dossier states 36 months at constant -20°C or -70°C, recommends aliquoting and avoiding repeated freeze-thaw, and lists dry ice or blue ice for shipping. Current product labels and lot documentation govern use.
Applications listed in the dossier include standard and long-range PCR, qPCR, RT-PCR, cDNA synthesis, sequencing, site-directed mutagenesis, microarrays and labeling.
Technical documentation & supply
For current lot documents, pack sizes and supply inquiries: [email protected].
Product documentation & sources
Official Tinzyme product information and stability report checked . Follow current product labels and lot documentation. Application listings do not establish a universal detection limit or maximum amplicon length.
Experimental Figures 1–13 and all source characteristics: supplied Tinzyme dNTP Quality Control and Performance technical material.